

Monitoring a Home Assistant server
As our intelligent home grows in number of devices and complexity, but also in usefulness, we must protect the Home Assistant server in order to avoid future problems or at least detect them in early.
Home Assistant offers several system monitoring components. For this article, we will use the System Monitor and Speedtest.net components to obtain system values and network data respectively.
Configuring the components
As in other articles, we are going to edit the configuration.yaml file to include the systemmonitor and speedtestdotnet components. Open the file and include the following lines of code:
speedtestdotnet:
scan_interval:
minutes: 30
monitored_conditions:
- ping
- download
- upload
sensor:
- platform: systemmonitor
resources:
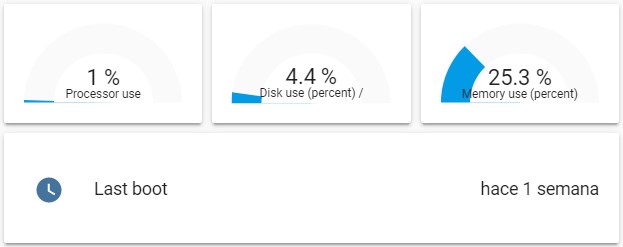
- type: disk_use_percent
arg: /
- type: memory_use_percent
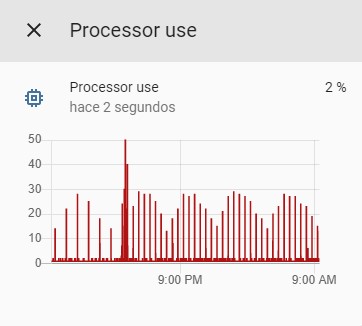
- type: processor_use
- type: last_boot
If you have a sensor node with another platform (e.g. miflora), simply add systemmonitor to the list:
...
sensor:
  - platform: systemmonitor
    ...
  - platform: miflora
    ...
...
The systemmonitor and speedtestdotnet components have other very interesting parameters, but for the moment, I am going to put the ones that I consider more interesting or are obligatory for the configuration to work. Check each one’s documentation to discover all the available options.
The
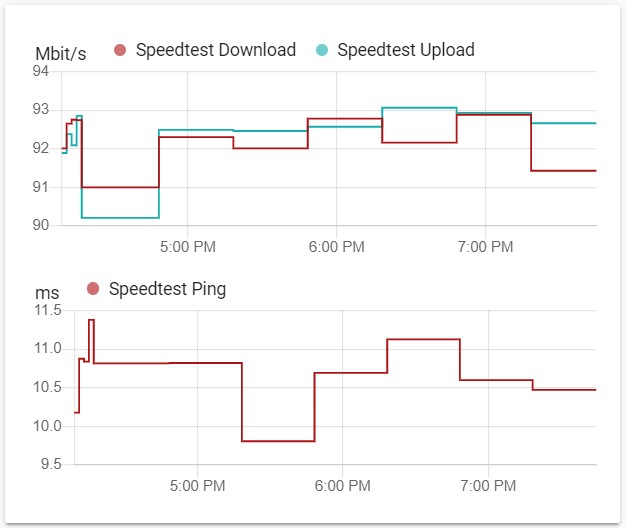
speedtestdotnetcomponent consumes a large CPU width (which can be analyzed from thesystemmonitorcomponent), if you notice outages or performance problems, increases thescan_intervalparameter to perform the network analysis every several hours.
Reboot the server from the configuration.
Visual interface
To show the data on Lovelace’s Dashboard, we’re going to use two special cards. These cards cannot be configured visually, so we will edit their code.
For speedtestdotnet add a History-Graph card:
entities:
  - sensor.speedtest_download
  - sensor.speedtest_ping
  - sensor.speedtest_upload
type: history-graph
For the systemmonitor sensor, create a Vertical-Stack type card:
cards:
  - cards:
      - type: gauge
        entity: sensor.processor_use
      - type: gauge
        entity: sensor.disk_use_percent
      - type: gauge
        entity: sensor.memory_use_percent
    type: horizontal-stack
  - entities:
      - sensor.last_boot
    type: entities
type: vertical-stack
Conclusion
With this information, and other information that may interest you (see documentation of the components), you will be able to monitor your server and predict future problems before they happen in a simple and visual way.
For example, to see if the space available on the server is running out, or if the Internet operator is offering less speed than contracted.
This and other articles complement the documentation of the GitHub repository where all the configuration of my house is available.